Survival is the metric
Ad libraries are public, and most people who open one count the ads. The count is the least useful thing in there. A company running four hundred ads is not four hundred times more interesting than one running four.
The signal is time. Nobody keeps paying to serve an ad that does not work. So the ads still running after three months have passed a test that cost real money, and the ones that vanished after two weeks failed it. You are reading the results of an experiment somebody else funded, with the losers already removed.
Worked on Loop Earplugs
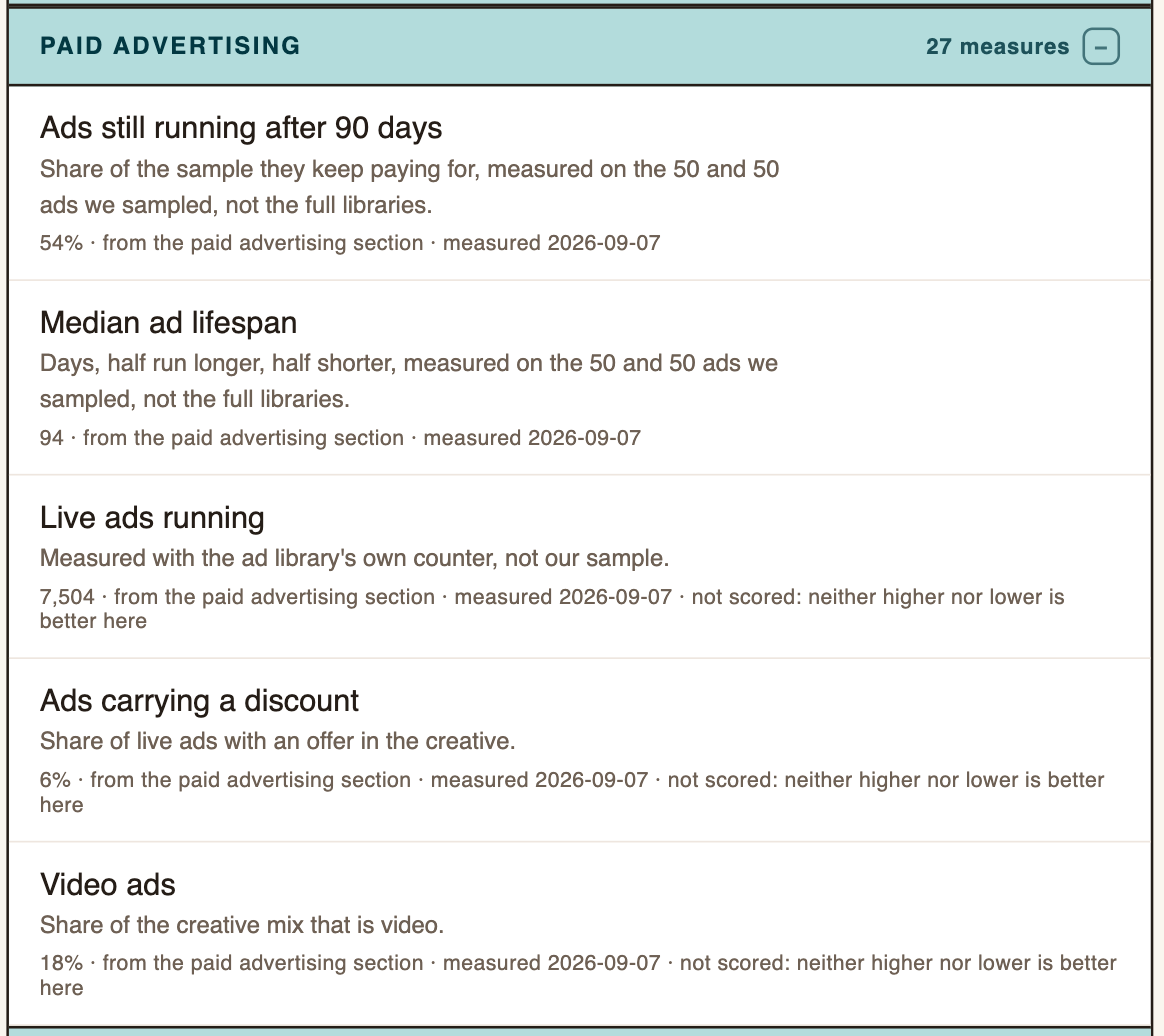
Measured 24 September 2026 from the public ad library, with 50 of their live ads read in detail:
Dynamic, no offer, lives longest: a median of 112 days. That is 29 of the 50: catalogue ads that rotate products from their store, with no discount in them. Image ads without an offer last a median of 97 days, video 104. That is not a company testing constantly. That is a company that found its shape and is now buying reach with it.
64% dynamic, 18% image, 18% video. The catalogue does most of the talking, across five placement types.
6% carry a discount. Three ads out of fifty, so price is not the lever they pull in their creative.
Reading the shape
Those numbers together describe a specific strategy, and it is one you can recognise or deliberately avoid.
A high median lifespan with a high survival rate means the winners are known and the budget is going into distribution. The interesting question for a competitor is not how to outspend that, it is what the surviving ads actually say, because that message has been validated at a scale you cannot afford to replicate.
The opposite shape, a short median with low survival, is a company still searching. That is a company you can beat on message, because they have not found theirs yet.
And the changes are sharper than the levels. A median lifespan dropping means the old winners stopped working. Video share jumping from a fifth to two thirds is a channel bet placed weeks before its results are visible anywhere else. An offer share climbing means the ladder is not doing its job and price has become the lever.
What to take from it
Read the survivors, not the newest. The ads at the top of the library are usually the most recent. The ones worth your attention are the oldest, and you have to sort by launch date to find them. Loop's longest-lived opening line is "Still thinking about it?", at a median of 164 days.
Look at where they land. A long-running ad pointing at a dedicated page rather than the homepage is a complete funnel that somebody proved. The page is as much of the finding as the creative.
Count the angles, not the assets. Loop's 50 ads rest on 18 distinct openings, and the five largest cover 56% of them. The argument is the thing to learn from.
Copy the shape, not the ad. Their money has voted for dynamic ads with no offer. Test that shape with your own angle, and give it the 112 days their median took before you judge it.
Where these numbers come from
The numbers come from the public ad libraries, and each ad's age comes from the start date the library itself publishes. The matrix sits with the other advertising frameworks on Loop's Benchmark, and the longest-running ads, with the hook each one opens on, sit in the paid section of the same report.
Any one ad's age can be looked up. What takes work is lining up fifty of them by format and offer, because that table, not any single ad, is where the finding is.
Pick one competitor. See what we find.
Your first benchmark is free. One domain, measured against you, no card and no call.