The average rating is the least interesting number
Everyone looks at the star rating. It is the one number that tells you almost nothing, because it is an average of thousands of people who mostly agree, and averages hide the disagreement that matters.
Loop Earplugs sits at 4.33 across the products we scanned, weighted by review count, and their most-reviewed product, Quiet, carries 18,984 reviews on its own. You cannot read that. Nobody can. And skimming the first page tells you only what the algorithm decided to show you today.
The average also hides the direction. On Trustpilot, Loop sits at 3.6 across every review but 2.58 across the 300 newest, where 65% are unhappy and none got a reply.
The analysis is not reading the reviews. It is grouping them, so that the recurring problems separate from the one-off ones.
Worked on Loop Earplugs
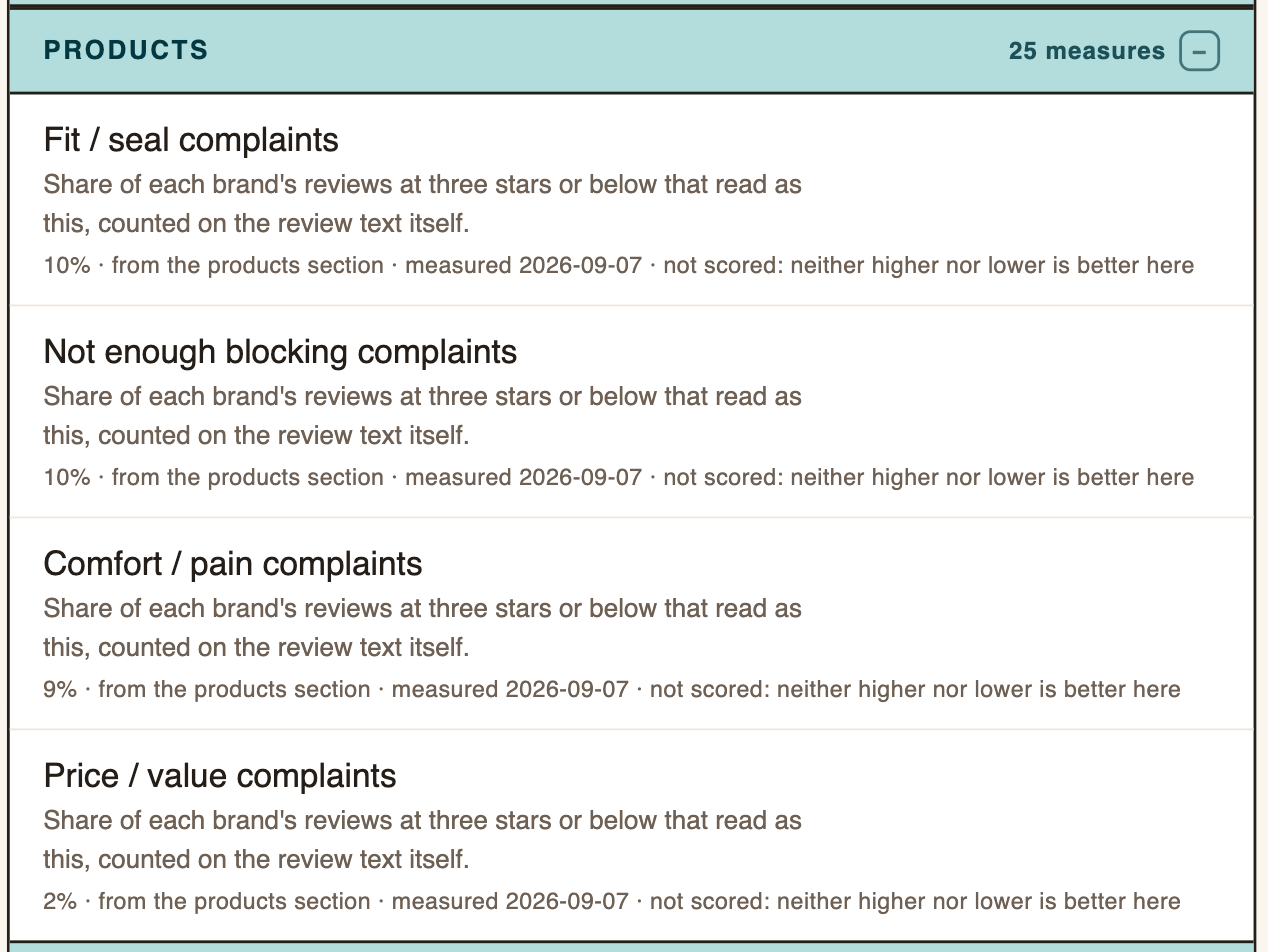
Their 282 reviews at three stars or below, out of 2,500 we read, grouped by theme and counted. Each review counts once, in the theme it matches most strongly:
Fit and seal: 30 of 282. About one in nine complaints is the product not sitting right in the ear.
Not enough blocking: 25 of 282. They bought the product for a job it did not do well enough.
Comfort and pain: 23 of 282. Distinct from fit: these are people for whom it sat correctly and still hurt.
Sizing and tips: 10 of 282. Sizing is fit by another route.
Price and value: 10 of 282. Level with sizing.
Case and durability: 6 of 282. The smallest theme, and five of the six are the same fault: a case that springs open.
Now look at what that pattern says. Fit, blocking and comfort together are 78 of 282, more than a quarter of all complaints, and every one of them is about the physical experience of wearing the thing.
Price is fewer than one in twenty-five. This is not a company with a pricing problem. It is a company whose product fits some ears better than others, and whose buyers are willing to pay but not willing to be uncomfortable.
What that is worth to a competitor
It is ad copy that has been pre-tested by their customers. If one in nine of their complaints is about seal, and your product seals better, that is not a claim you have to invent. It is an objection their own buyers wrote down, and you can answer it in their words.
It tells you which comparison to pick. The useful head-to-head is not your best product against their best product. It is your product against the one at the bottom of their catalogue, ranked worst first, where their reputation is currently being spent. On Loop's store: the Travel and Good Night bundles, both at 3.8.
It tells you what not to compete on. Ten price complaints in 282 is a clear instruction: do not open with cheaper. You would be answering a question their buyers are not asking.
And the shares move. A theme going from 4% to 10% over a quarter is a regression, a new supplier, or a new product that does not work as well as the old one. That is the moment worth catching, and it is only visible if somebody counted the same way last quarter.
The trap in doing this by hand
Reading twenty reviews and forming an impression feels like research and is closer to superstition. The reviews you happen to read are the ones the platform sorted to the top, which are usually the most helpful or the most recent, and neither is representative.
Worse, an impression cannot be compared to last quarter's impression. You will remember that people complained about fit. You will not remember whether it was one in twenty or one in eight, and the difference between those two is the entire finding.
Where these numbers come from
The review texts on the competitor's own store, 2,500 for Loop on this reading, grouped into themes and counted, then held against the same count from the previous collection. Trustpilot figures come from their public profile. The theme shares sit on the Benchmark, and the products behind the rating, weakest first, sit under the same band, with a link to each product page so you can read the actual sentences.
A percentage you cannot open is a claim. A percentage that opens into the reviews it was counted from is evidence.
Everything on customer reviews
What a competitor's reviews say about their product, and how to read a review listing without being misled by the score.
Pick one competitor. See what we find.
Your first benchmark is free. One domain, measured against you, no card and no call.