What the canvas asks
The strategy canvas comes from Blue Ocean Strategy by W. Chan Kim and Renée Mauborgne. Along the bottom go the factors a category competes on. Up the side goes how much each company offers on each one. Then one line per company.
Where the lines run together, the companies are fighting for the same buyer with the same weapons. Where they separate, one of them has chosen a different game.
The picture is not the point. The decision after it is. The book pairs the canvas with four questions: which factors to eliminate, which to reduce, which to raise, and what to create that nobody offers yet.
Why the workshop version flatters
In most workshops the levels are scored by hand, by the people whose strategy is being drawn. The line that comes out shows what the team believes, and it rarely shows the team losing.
The fix is the rule behind any honest market map: use factors you can read from public data, and settle them before you see where anyone lands.
Six factors you can read, not score
The canvas in the report uses six, each read off something the company publishes:
- Range breadth: how many products a buyer can choose between.
- Price level: the median price across every variant. Higher means dearer.
- Weight of proof: the reviews carried across the range.
- Review score: the average of those reviews, weighted by how many sit behind each product.
- Published pages: the pages listed in their sitemap.
- In stock right now: the share of variants a buyer can actually buy today.
The units do not match, so each factor is scaled against whichever brand leans on it hardest. That brand sits at 100.
Worked on Loop Earplugs
Read on 24 September 2026, Loop has 68 products, a median price of $34.95 across every variant, a review score of 4.33, 10,024 published pages and 92% of variants in stock.
That median counts every variant, spare tips and carry cases included, so it is not what a typical order costs. For that, price architecture is the better tool.
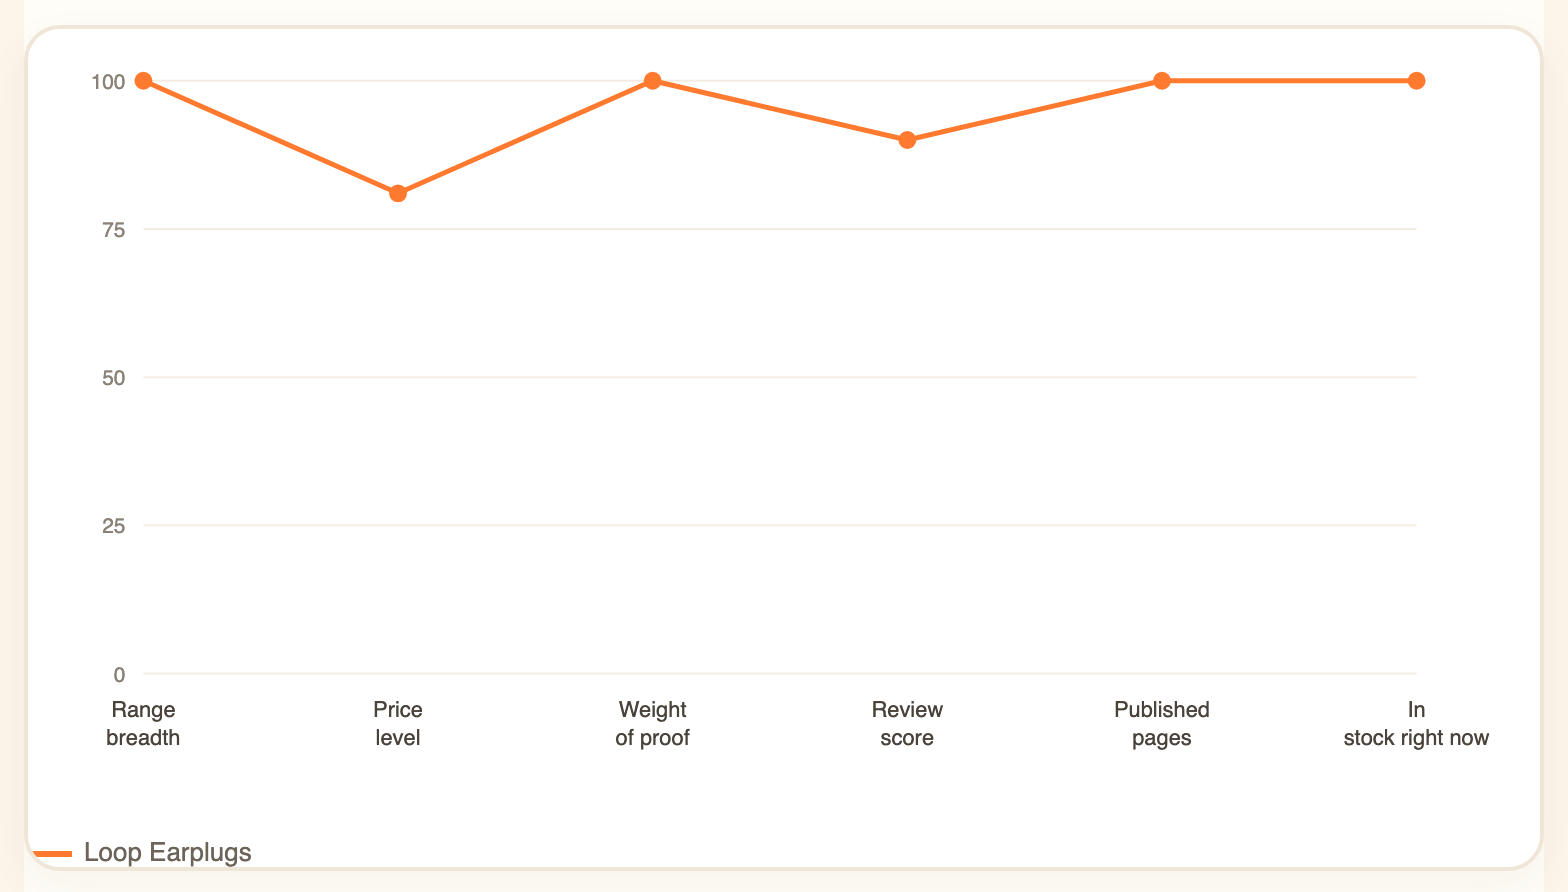
The shape says what Loop competes on. Scaled against the one rival in the report, Loop sits at 100 on four of the six factors: range, proof, pages and stock. It dips on the two where the rival reaches further, price level and review score.
That is a brand competing on presence: more products, more reviews, more pages and more of it on the shelf, rather than a higher price or a better score.
What to do with it
Say you are the challenger looking at that curve.
Eliminate the range fight. Matching 68 products is expensive and wins nobody over. A buyer choosing between two brands needs the right product, not 68 of them.
Reduce the content race. 10,024 pages is a head start nobody closes by publishing faster. Answer the questions buyers actually ask, better than anyone, and stop there.
Raise the score. Loop's line dips at 4.33, and the score sits on every product page a buyer opens. With fewer reviews behind it, a smaller brand's score also moves faster, in both directions.
Create the factor that is not on the chart. Six factors are what can be read from a store. The one that reshapes a category is usually one nobody measures yet, which is exactly why it is not on anybody's canvas.
What it cannot tell you
The levels are relative to the brands on the canvas, not to the category. Both curves can sit low on a factor the whole market has given up on, and nothing here would say so.
The six factors come from their catalogue, their review widget and their sitemap, all read on the same day. The canvas and the numbers behind it sit on Loop's benchmark.
Pick one competitor. See what we find.
Your first benchmark is free. One domain, measured against you, no card and no call.