
Their bill is public
A go-to-market strategy is usually written from the inside out. Our product, our customer, our channels, our price. The team fills in a template, argues about the persona, and ships.
In almost every market, someone has already paid to test those same choices. They ran the ads, set the prices, picked the countries and hired the sales team. Most of that is visible from outside: on their store, in the ad library, in their job posts, in what AI assistants say when a buyer asks.
Every step of your plan has a column you can fill in from a rival's public record before you spend anything. This article walks through the nine steps and shows that column, filled in from Loop Earplugs.
What a go-to-market strategy is
A go-to-market strategy is the plan for how a product reaches its buyers: what problem it solves, for whom, in which markets, through which channels and sales motion, and at what price. It ends with the numbers that tell you whether it worked.
It is not the same as a marketing plan, which covers the campaigns inside one or two of those channels. It is not a launch plan either, which covers the few weeks around a release date. The go-to-market strategy sits above both and decides what they are for.
The 9 go-to-market steps, each checked against a competitor
Each step has two parts. What you decide is the inside view. What the competitor already shows you is the outside view, read from public sources. The Loop numbers were measured on 28 September 2026 unless a different date is given, and sit on Loop's public benchmark.
1. The problem and the category
What you decide: the problem you solve and the category you want to be filed under. The name matters, because buyers search for the name, not for your product.
What the competitor already shows you: the words the category is asked in. The 18 buying questions in Loop's report are framed by situation, not product: "best earplugs for sleep", "best earplugs for concerts", "best earplugs for ADHD and sensory overload".
Across five AI engines, Loop is named in 79% of the answers. Where it is named, it comes first 69% of the time, but only 37% of those mentions frame it positively. That gap is how share of AI answers tells you who owns the category, and how firmly.
2. The customer
What you decide: the ideal customer profile and one or two personas, written as people with a situation, not a demographic.
What the competitor already shows you: who actually bought, and what let them down. Out of 2,500 Loop reviews read on 24 September, 282 sit at three stars or below. The largest themes are fit and seal (30), not enough blocking (25) and comfort and pain (23). Those are buyers who expected something specific. The method is in voice of customer.
3. Demand and competition
What you decide: whether demand is large enough and who already fills the space.
What the competitor already shows you: their size and their footprint. Similarweb's model puts Loop at about 4.4 million visits in August 2026, down 2.2% on July. Their site has 9,996 indexed URLs, 3,500 of them blog posts.
A spike needs care: Google Trends interest in "Loop Earplugs" fell 52% week on week after a one-day spike on 20 September, which is one day, not a trend. Draw the whole field with a market map and compare it with category benchmarks.
4. Positioning and message
What you decide: one core claim, three supporting pillars and the proof under each.
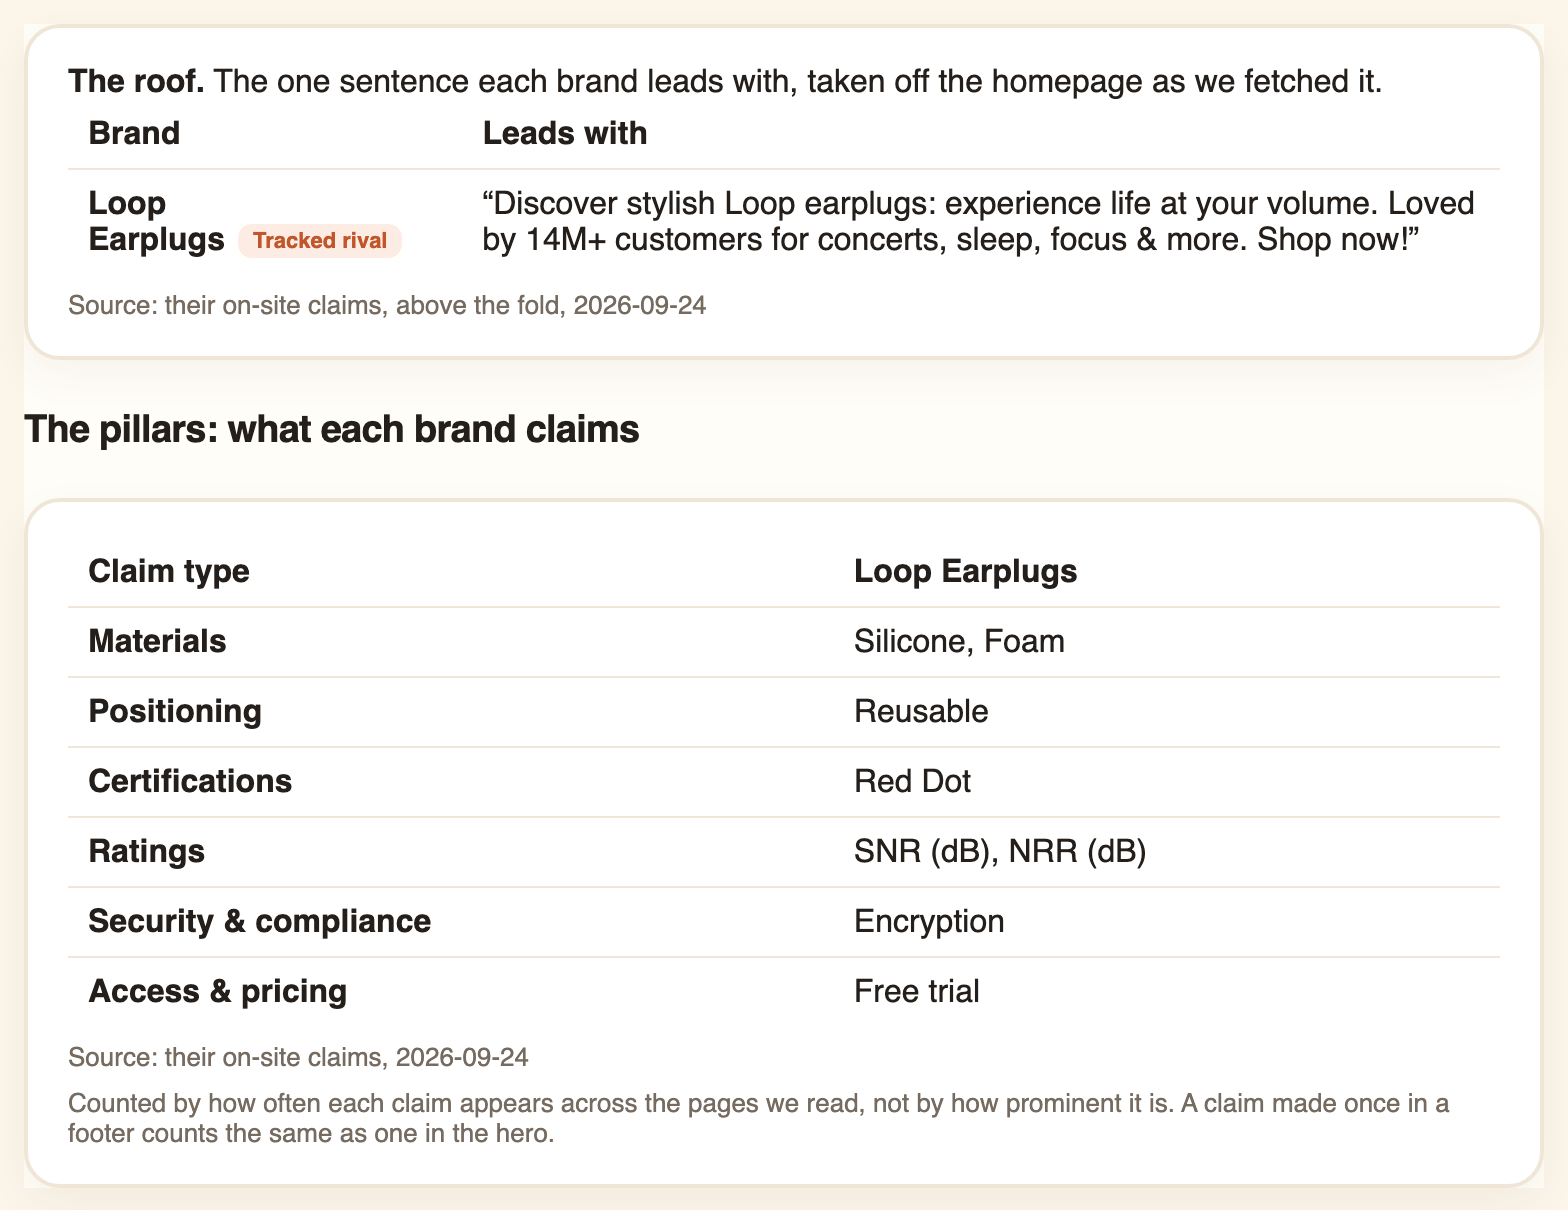
What the competitor already shows you: their claim, and where their customers say it breaks. On 24 September Loop's homepage led with "experience life at your volume", for "concerts, sleep, focus & more". Not enough blocking is their second biggest complaint theme.
Loop's store rating is 4.35. On Trustpilot it is 3.6 across 8,133 reviews and 2.58 across the newest. When a rival's promise and its newest reviews point in different directions, the space between them is a position you can take.
5. Price and packaging
What you decide: the entry price, the middle where the margin sits, the top tier, and how often you discount.
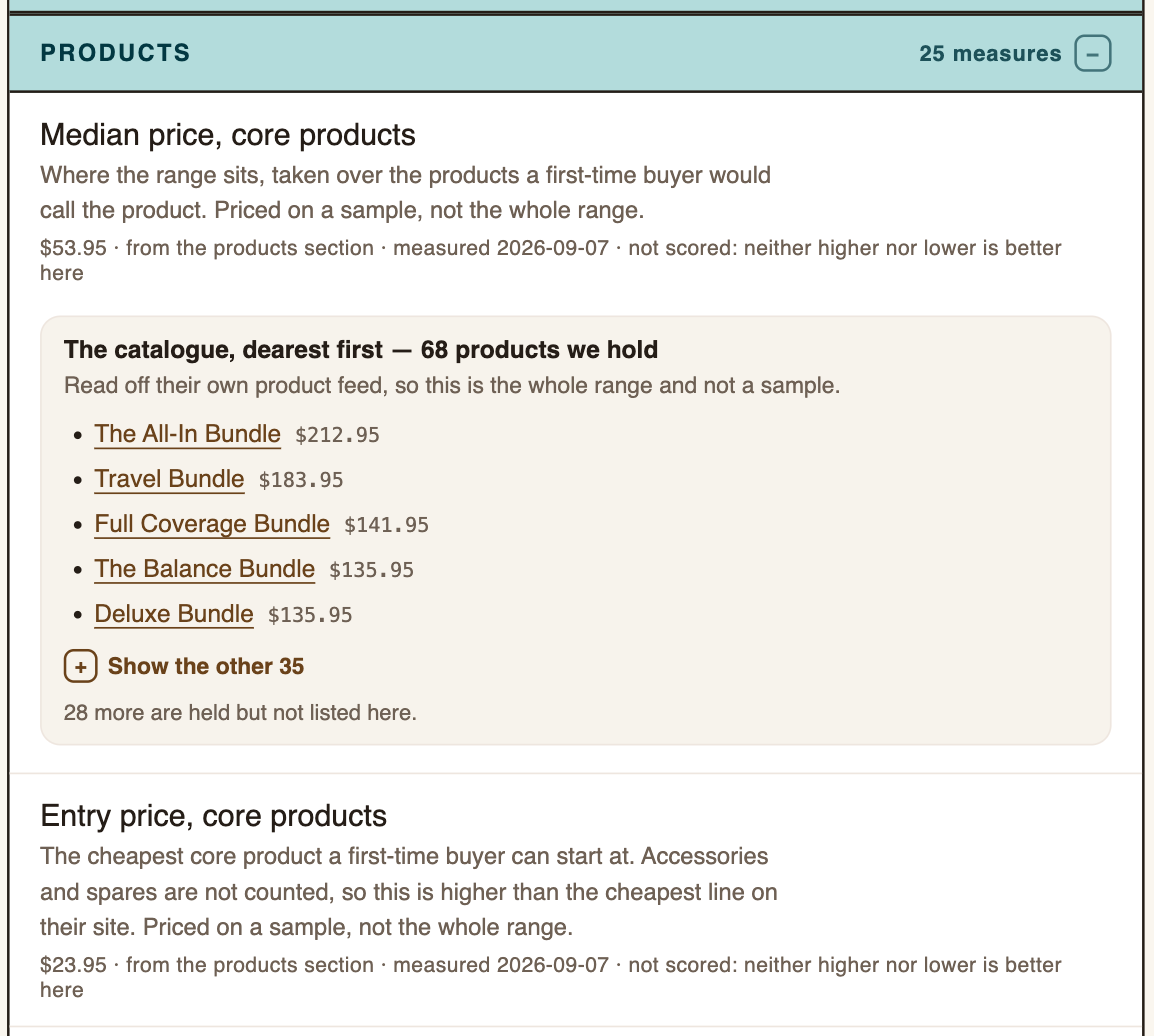
What the competitor already shows you: the whole ladder, and how it moves. Loop sells 66 products. The median core product costs $52.95 and the spread from cheapest to dearest is $185.
Between the snapshots of 15 and 24 September, 38 products dropped in price. 18 of the 38 moved by exactly -$1.00, which is one change landing on 18 products rather than 18 decisions. The biggest cuts were $4.00, on the Travel Bundle and The All-In Bundle. Their return window is 100 days, which is part of the price too.
6. Channels
What you decide: where buyers will first meet you, and where you will spend.
What the competitor already shows you: their traffic mix and which ads they never turn off. In August 2026 Loop's visits came 49.4% from search, 18.0% direct, 13.2% social, 9.0% display ads, 6.3% email, 2.1% referral and 1.3% affiliate. In Meta's ad library they had 6,989 live ads on 24 September 2026, down from 7,504 on 6 September.
In the ads collected on 6 September, only 6% carried a discount, the median had run 93 days and the longest 146. Of 50 analysed in detail, 29 were catalogue ads rotating store products. Around the brand sit 169 creators. See competitor ads, and check the marketplace in the channel you forgot.
7. Sales motion
What you decide: self-serve, inside sales, field sales or partners, and who owns the buyer at each stage.
What the competitor already shows you: where they put their people. Loop had 19 open roles on LinkedIn. 37% were in sales and marketing, 21% in engineering, and 13 roles opened while 18 closed in 18 days. For a software rival, the pricing page, the "talk to sales" button and the changelog say the same thing. Those are in 5 signals of how fast a SaaS rival ships.
8. Launch and timing
What you decide: the date, the hook, and what happens in the first week.
What the competitor already shows you: what a launch week looks like when they run one. The week to 25 August was Loop's launch week for the Paris Hilton x Loop edition on Instagram and Facebook.
Posts drew 2,994 and 1,842 likes, and one drew 953 comments. Only 6% of their ads carried an offer. It sat in the popup and the inbox: a seeded address received 22 emails since 18 August, about 4 a week.
9. Goals and the loop back
What you decide: a few goals, SMART or as OKRs, split into leading inputs you can move this week and lagging outcomes you judge each quarter.
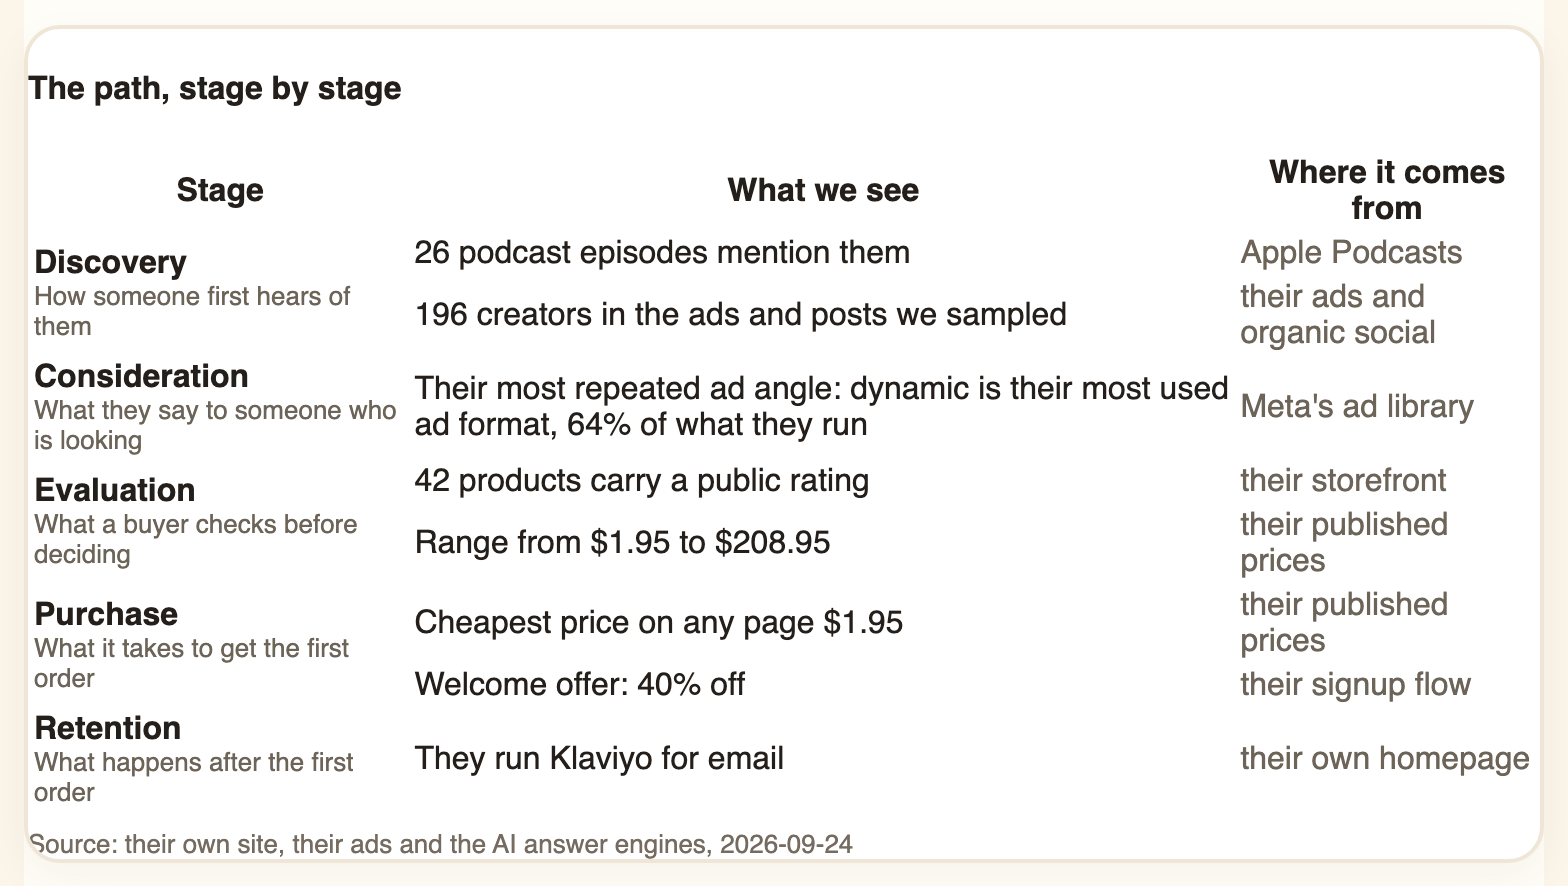
What the competitor already shows you: their inputs, never their outcomes. You will not see Loop's revenue. You can see every price, ad and job they posted, dated. Set your goals on the same split, and read theirs as a line, not a snapshot. The distinction is in leading vs lagging indicators.
Choosing a motion: sales-led, product-led, partner-led or creator-led
The steps decide what. The motion decides how the buyer moves. A funnel treats it as a line: awareness, consideration, decision. A flywheel treats it as a loop, where each happy customer lowers the cost of the next through referrals, reviews and content left behind.
Four motions cover most markets. Sales-led puts people between interest and purchase. Product-led lets a free tier or trial do the selling, which moves the burden into the product and the pricing page, as product led growth explains. Partner-led borrows someone else's customers. Creator-led borrows someone else's audience.
You can usually tell which motion a rival runs without asking. Is the price on the page or behind a call. Who are they hiring. Where does traffic come from. Loop's answers point at a self-serve consumer brand that leans on creators: prices on every page and no call to book, 169 creators around the brand, and a launch built on a named edition.
Social brings 13.2% of visits, so creators are one engine, not the whole motor; search, at 49.4%, is still the largest. Whether their loop actually compounds is the four-question test in the product flywheel.
Entering a new market: what to check first
A new country is a new go-to-market strategy with a shorter memory. Three checks come before any budget.
Where the rival already has buyers. Similarweb's model puts Loop's August 2026 visits at 34.7% from the US, 8.7% from Great Britain, 5.9% from Australia, 5.8% from Spain, 5.6% from Germany and 4.8% from Canada. A market with visits but no local site is served, not defended.
Where they have committed. A localised site means local prices, returns and support. Counting them from the hreflang tags, not the URLs, is covered in one brand went from 8 localised sites to 22. Local search demand and local reviews come next. We did not measure either per country for Loop, so load their local site on a phone and read the reviews in that language yourself.
After launch: measure against the market, not only yourself
Most go-to-market plans end at launch day and measure only their own dashboard afterwards. That misses half the result. A launch lands in a market that keeps moving, and a rival's price cut in the same fortnight can look like your campaign failing.
So compare two fortnights: what moved at the rival in the fourteen days after your launch, against what usually moves. Loop's Changes page shows the kind of line to watch for.
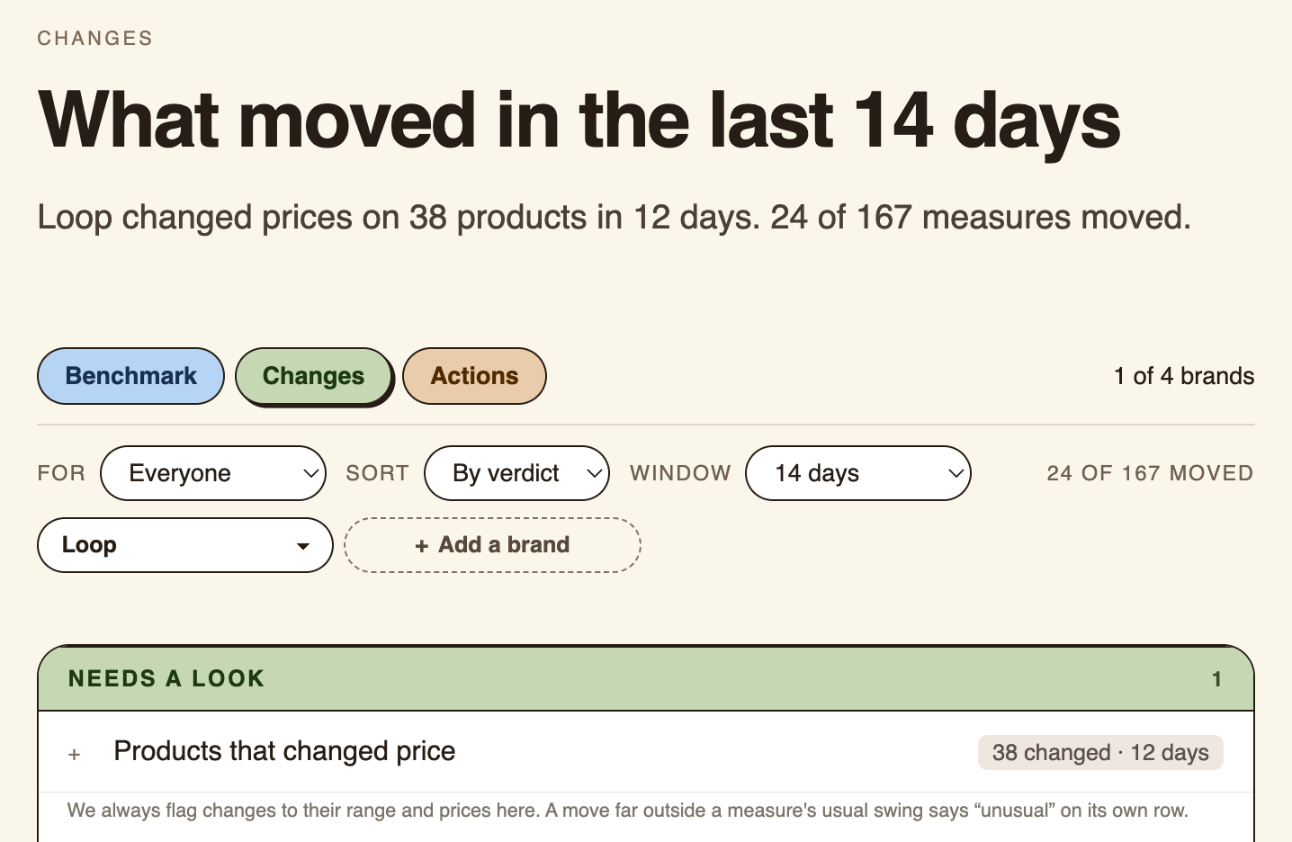
A measure has only moved when the move is bigger than its own usual swing. We learned that on our own page. A sample of five ads that is five different ads every fetch looks like movement.
A value written again without being fetched again looks like "unchanged". A rating up 0.04 is noise. And check before you trust: Loop's backlinks jumped on 24 September, mostly nofollow, and we cannot yet tell a recount from real links.
A one-page go-to-market template
The nine steps on one page. Fill in the middle column from inside, the right column from a rival's public record.
| Step | What you decide | What the rival shows |
|---|---|---|
| 1. Problem and category | Problem, category name | Questions buyers ask; share of AI answers |
| 2. Customer | ICP, personas | Who reviews them, and what disappoints |
| 3. Demand and competition | Is the market big enough | Visits, indexed pages, search interest |
| 4. Positioning and message | Core claim, pillars, proof | Their claim against their newest reviews |
| 5. Price and packaging | Entry, median, top tier, discounts | Price ladder and every price move |
| 6. Channels | Where buyers meet you | Traffic mix, long-running ads, creators |
| 7. Sales motion | Self-serve, sales, partners | Pricing page, open roles by team |
| 8. Launch and timing | Date, hook, first week | Their launch weeks, where the offer sits |
| 9. Goals | Leading and lagging targets | Their dated inputs, read as a line |
FAQ
What are the five pillars of a go-to-market strategy?
Lists vary. A common five is market, customer, message, channels and price. The nine steps above cover all five and add the sales motion, the launch and the goals.
How long does a go-to-market strategy take?
The first draft takes days, not months. The outside column is the slow part if you gather it by hand, because a single reading says little. It takes a few weeks of the same measures to see what a rival changes and what stays put.
Do you need one for an existing product?
Yes, whenever you change the market, the price or the customer. An existing product entering a new country or a new segment is a new go-to-market decision.
Is go-to-market different for DTC and B2B?
The steps are the same. The evidence differs. A consumer brand shows its hand in prices, ads, reviews and creators. A B2B or software rival shows it in the pricing page, the changelog, the status page and the job posts.
Pick one competitor. See what we find.
Your first benchmark is free. One domain, measured against you, no card and no call.